Profiling Performance
When running an Nx command, many tasks are run at different times in different processes. Visualizing where and when the tasks were executed can help optimize the entire run to be quicker.
How to Profile the Performance of Running Tasks
- Prepend
NX_PROFILE=profile.jsonbefore running targets with Nx. For example,
❯
# This builds the "cart" application and creates a profile.json file
❯
NX_PROFILE=profile.json nx build cart
❯
# This builds affected projects and creates a profile.json file
❯
NX_PROFILE=profile.json nx affected --target build
- Open the Performance Tab in Chrome Devtools
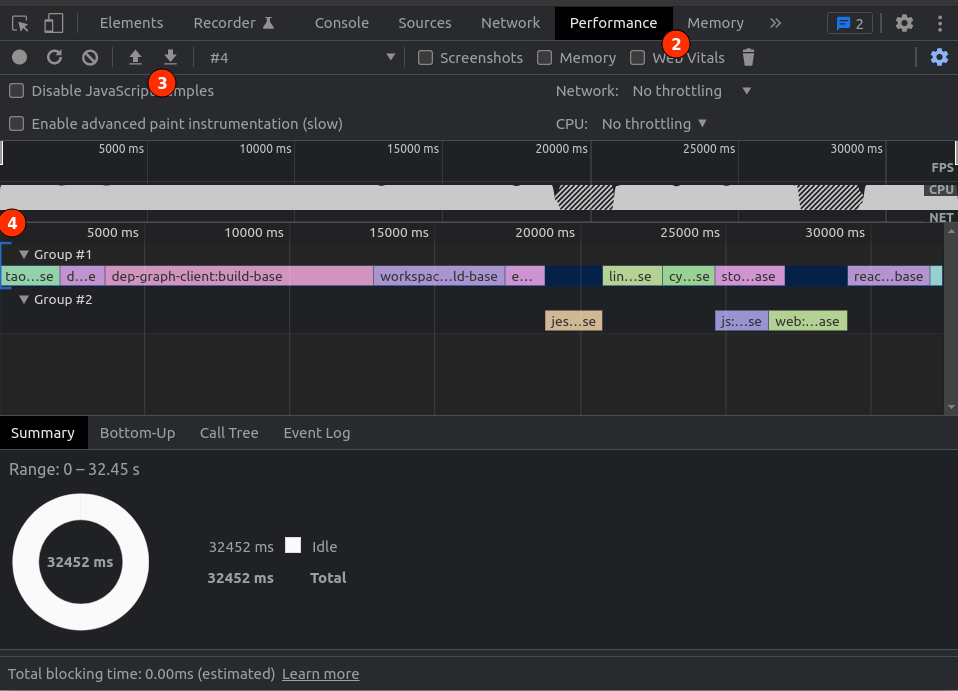
- Click the upload button and open the
profile.jsonthat was created. (Or drag the file into the window) - Expand each group to see the names of the tasks which were run
Optimizing the Performance of Running Tasks
Now that you have visualized how the tasks were run, you can try tweaking things to make the process faster. Generate profiles after each tweak and compare the results.
- Are there tasks that you did not expect to be necessary? Sometimes, more tasks are captured by a command than expected. Excluding them could free up workers for other tasks.
- Try adding more workers. Did the new workers handle tasks while other workers were busy? This will likely result in faster runs.
- Are a lot of the tasks waiting on a single task to be completed? Splitting that project into smaller projects may allow fewer projects and therefore tasks to depend on a single project/task. This will allow for more room to parallelize the tasks.
Profiling Nx Commands
Nx offloads much of the heavy lifting to the Nx Daemon, which helps speed up task execution. However, you might still encounter slowdowns, not during the task execution itself, but in the moments leading up to it when invoking tasks through Nx. This can often happen when you're using a large number of Nx Plugins, whether they come from the core team or the community.
To investigate and optimize these slowdowns, you can use the NX_PERF_LOGGING environment variable. This will give you detailed performance logs and more precise timings, allowing you to pinpoint where the delays occur.
Here's an example of running the build of the admin project with performance logging enabled:
❯
NX_PERF_LOGGING=true NX_DAEMON=false npx nx build admin